

Awareness is a double-edged sword.
For those worried that the Nooksack River will flood again, there’s one piece of information to rule all others.
That information comes in the form of a simple graph of the river’s height near the spot where it occasionally spills north. It’s a graph that can be incredibly useful in the right hands. But it can also cause unnecessary worry and anxiety for those unfamiliar with it.
After 2021’s flood took many by surprise, it’s not unreasonable for residents to seek out their own information.
But even as the Nooksack is likely the flood will be repeated at some point over the coming decades, the odds of any one atmospheric river triggering another massive flood are very low.
So how do you figure out whether the next atmospheric river is one to be worried about? A great resource is a key American graph that depicts the river’s current—and projected—height. It’s not foolproof and it shouldn’t be your only source of information. But it’s some of the best data we have about just how likely it is that Canada will see US water in the near future.
Here’s where to find the chart—and just as important, how to interpret what it says.
The Graph
The graph in question is a measure of the height of the Nooksack River at a place called North Cedarville, just upstream of Everson, Wash., the location where the Nooksack escapes its basin and floods into Canada during particularly high-water events.
Here is how the graph looked on Tuesday morning.

The blue line is the river’s height over the previous few days. The dotted line is its projected height over the next week. The website is run by the National Oceanic and Atmospheric Administration, a US government agency.
Here is how the graph looked Wednesday morning.

You can see that the river actually rose about a foot higher than expected before quickly retreating.
Here is how the graph looked two years ago, around noon on Nov. 14, as rain poured down on Sumas Prairie, but well before Canadian officials sounded the alarm.

A day later, this is how the graph looked.

The graph isn’t a perfect forecast. But it can suggest just how worried you should be before or during a major rain event.
You can see that as water rises, the graph seems to change. It zooms out, with the scale—as seen in the numbers on the left side—expanding and the space between the numbers shrinking. This is important to understand. During low water, the top of the graph might not really represent much of a flood at all. The most important thresholds to know and understand are the coloured areas that become visible in the graph as the water rises.
The colour guide
Here’s what the different coloured areas of the graph mean.
White: When the measured height of the water is in a white, uncoloured area, the Nooksack is essentially flowing in a normal fashion around Everson. The water is cruising within its channel, and and all is well. If the prediction line rises significantly but stays within the white area, there is very, very little to worry about.
Yellow: This is the “action” stage. It means that the water is pretty damn high. But it’s still in the river channel. Yellow is still pretty mellow.
Orange: This represents minor flooding in the area surrounding the river itself. For Canadians, this is very important to note. The Nooksack can do considerable damage in the United States while leaving Sumas Prairie unscathed. At the start of 2020, a devastating flood swamped Sumas, Wash., just south of the border, but left Canada essentially untouched. On Tuesday, the river reached its minor flood stage but caused few problems in the Everson area.
Red: This represents “moderate” flooding. Like the minor (orange-coloured) flooding stages, this can cause significant problems within the US, while not impacting Canadians. You should not panic if water hits—or is projected to reach—the moderate flood stage. But you should be prepared for the possibility of impacts north of the border—and the fact that a predicted moderate flood can turn into something greater, as seen in 2021. One should also be aware that the accuracy of the gauges themselves can fluctuate depending on the state of the riverbed, sediment levels and other factors.
Purple: This is the Nooksack’s “major” flood stage. At this point large amounts of water are breaching, or expected to breach, the Nooksack’s north bank. Much of that water may be flowing toward Canada. In 2021, the river gauge stopped working around this point. Once a flood gets massive, the gauges become less helpful anyways because, with no bounds to contain it, water starts to spill everywhere. Like a faucet pouring water into a sink, the height of the water in that sink only rise so high once the water has no constraints.
At the major flood stage, there’s a decent chance that there will be some impact in Canada.
The cushion
It’s still not panic time, though. Once the Nooksack starts to flood, there is a considerable distance for the water to travel before it gets to the international border. That area serves as a buffer for Canadian residents.
In 2021, that meant that while the Nooksack hit “major” flood stage just after midnight on Nov. 15, major impacts weren’t felt in Canada until half a day later. The distance between the river and the border gives Canadian residents and officials time to prepare if they are closely monitoring the river. (Few appear to have been doing so in 2021). The land in between also can soak up considerable water, mitigating the scale of floods that are relatively brief.
So even if the gauges are offline above the major flood stage, it’s still worth monitoring just how long the situation stays that way.
The 2021 flood was so bad partly because of the length of time that the Nooksack was in its major flood stage. An event that hits the ‘major flood’ stage for a much-shorter amount of time will do considerably less damage. Some major Nooksack floods cause considerable damage in the United States, even as Sumas River is more or less able to handle the water flowing north. So it’s not just how high the Nooksack rises, as measured at North Cedarville, but how long it is in that major flood stage. In 2021, it was at that stage for more than a day.
There are a couple other important things to keep in mind.
Here’s a graph from two days before that second wave of storms in 2021.

And here’s the graph from the following day.

When looking at the river’s predicted level, the projection line can change significantly as weather forecasts shifts and consolidate. The further the predicted high-water event is from the present day, the more uncertainty there will be about just how the river will behave. (You can also see a related river-forecast page with probability information further down on the graph’s webpage or via this link.)
Which is why weather forecasts can be just as good an indicator.
The initial storm that caused the 2021 flood involved incredible amounts of rain. If you look at the forecast and see predicted rainfall totals under 100mm for Chilliwack or Abbotsford, the odds of a major Nooksack flood are relatively low. (Though the saturation level of the ground, the temperature on Mt. Baker, pre-existing river levels from other recent storms can also play a large impact. That’s one reason why the chart is very useful.)
As you watch the chart, you should be monitoring other channels. The chart is useful, but you aren’t a river expert. Of all the organizations in the region, the people and local government in Sumas, Wash., has the best track record in delivering reliable and timely preparation information. That community has the most experience with the Nooksack and its Facebook page is usually a good indication of how seriously officials there are taking the threat. In 2021, the folks there were filling sandbags days before the Nooksack even began to rise. But also remember that Sumas can sustain significant damage without Sumas Prairie taking a large hit. So even when they are reporting considerable damage, it’s possible that a flood may leave Canada mostly unscathed.
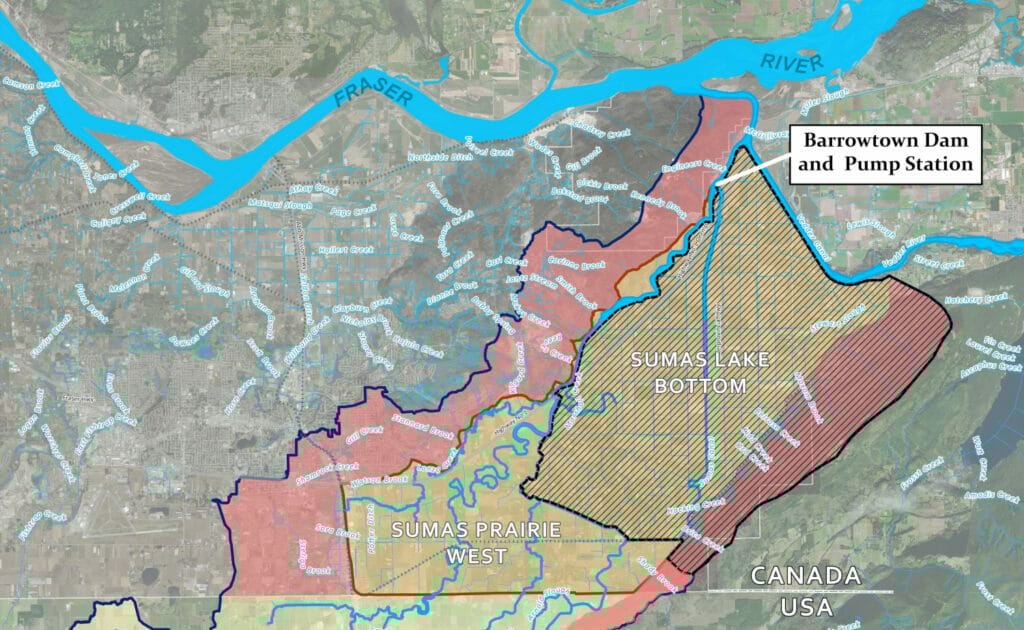
There is a very large difference between the western part of Sumas Prairie and the eastern, lakebed portion. It takes a much larger flood to breach the dikes protecting the lakebed portion than to inundate the area in the western portion of the prairie. We wrote about that dynamic here. If you’re a commuter, note that Highway 1 travels through both halves of the prairie. A flood in the western half can shut down the highway fairly early, so be prepared.
You should also use your common sense and your own eyes. If heavy rain is still falling outside your window, the Nooksack River may still be rising. But if the rain has stopped or slowed, that’s good news! The river may keep rising for a while, as water continues to make its way down the slopes of Mt. Baker, but the end of rain in one part of the Fraser Valley suggests rain may also slow on Baker and the river may reach its peak relatively soon.
There’s one other important thing to keep in mind: the lines of the graph reflect the river height, as measured on its leftmost axis. But on the right, you can see the corresponding water volume for the river height. You’ll notice those figures do not increase in a steady pattern. This is because all rivers are profiled like this, to one extent or another.

The higher a river rises, the more water it takes to raise its height even more. The bottom metre of any river contains exponentially less water than the top metre. And a river that is nearing the height of its banks requires a lot of water to push it even higher. That means that the higher the Nooksack gets, the more water it takes to make it rise even harder.
So be informed and prepared—but understand that the chart can look scary while actually showing that a flood is unlikely and that one shouldn’t panic.